How The Pandemic Changed Our Budget
Given that we are about 10 weeks into the state of emergency here in Nova Scotia, and I have been off work for 11 weeks, I thought it would be interesting to look at our budget before the pandemic and compare it to what it’s currently like.
Let me tell you, this was an eye opening exercise.


Method
I budget biweekly, and so I got out my budget binder, and first I added up 6 pay periods of pre-pandemic totals for income, fixed expenses, and variable expenses. I also pulled out the info for groceries, eating out & gas just because I thought the comparison would be interesting.
Then I added up 5 pay periods of during pandemic totals for the same categories. I created an average for each one to compare.
Income
Thanks to my husband getting a raise right at the beginning of the pandemic, and the CERB government program, our income is only down 4% from it’s usual. Without the CERB our income would be down 30%.
Thankfully because we live within our means, we have been able to deal with less income and we haven’t had to dip into our emergency fund at all.
It was announced this week that massage therapists will be able to go back to work in June. It may be awhile before I’m back at 100% of my previous income, but I know we’ll be able to manage until then.
Fixed Expenses
Being that these are fixed expenses they haven’t changed a whole lot. In fact the only thing that has changed is that I have stopped our automatic savings that goes into our travel account. While that was sad for me to do, reality is that we probably won’t be traveling for a little while, and we needed that cash flow for other parts of our budget.
Our fixed expenses dropped by 16%.
Variable Expenses
Wow, variable expenses have been a struggle! At first I thought we would be spending way less, because we wouldn’t be driving far, and we couldn’t go out shopping.
I was wrong.
Our variable expenses have increased by 9%. I’m not surprised about this (just wait until you read about our groceries!). I have definitely been ordering online more than usual, and we’ve splurged on a few things to make our time at home more fun.
Here are a few things we’ve bought that we probably wouldn’t have normally:
- Deck chair
- Paint for downstairs bathroom
- Organization bins
- Alcohol
- Art on Etsy
- Ticket To Ride board game + expansion pack
As you can see, we’ve been playing a lot of games, and doing some organizing and redecorating! I actually don’t regret any of these purchases at all.
Groceries
Within variable expenses, I picked out a few categories that I thought changed the most. Groceries have been a huge struggle for us since starting physical distancing. We are home all the time, and eating more. Plus I have been doing some baking that I normally wouldn’t have time to do.
I’ll be completely honest that I have been struggling to get our grocery spending under control and we’ve ended increasing our grocery spending by 38%.
It’s not the end of the world, but it’s something I want to get a handle on going forward.
Read More: Budget Recipes!
Gas
Of course, now that I am off work and that my husband is working from home, I thought it would be funny to see how much our gas consumption has changed! We decreased our gas spending by 91%! I guess that’s what happens when you hardly leave your house ;).
Eating Out
We actually don’t eat out very often. We only eat out probably once every 6 weeks or so. I miss restaurant food so much right now though! We’ve only gotten takeout once since the pandemic started. It was delicious but I definitely missed the magic of sitting in a restaurant, since we almost always eat out with friends.
Our restaurant budget has decreased by 67%.
Budget Percentages
I also decided to take a look at our general budget percentages. Lots of interesting info here:
Housing = mortgage, property tax and home insurance
Transportation = gas, bus tickets, parking and car insurance
Utilities = water, power, phone, internet, and Netflix
Food = groceries and eating out
Savings = retirement savings, car savings and emergency fund
All Else = clothing, gifts, pets, personal care, entertainment, travel & Christmas sinking funds, life insurance, charity, misc spending
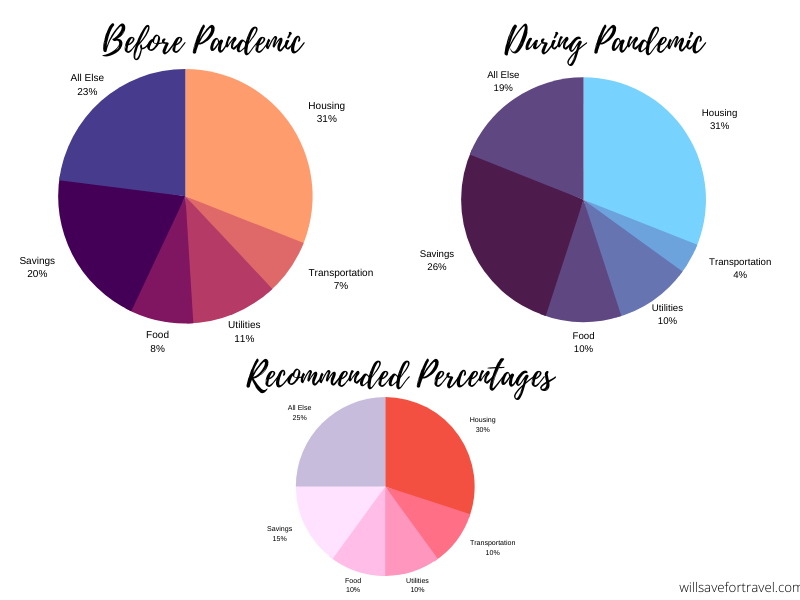
Overall I’m pretty happy with how our percentages fall.
I included the recommended percentages, but of course that is just a guideline! If you have debt you’d have to work that in by decreasing spending in other areas. As long as it adds up to 100% you’re golden!
Final Thoughts
This was definitely an eye opening exercise, and interesting to see how our budget has changed over the last almost 3 months while we’ve been home more (and working less in my case!).
You can’t make changes without data! We are committing to decreasing that grocery budget, I’ll give you an update on that soon!
Has your budget changed over the past few months? Let me know!